
Page 170 - Maths Class 03
P. 170
a. Which day had the highest temperature ?
b. What was the temperature on Saturday ?
c. How much higher was the highest temperature recorded on Monday than
the temperature recorded on Saturday ?
d. Discuss any patterns that you can see, shown in the graph, for the
temperature over the week.
e. The people who made this graph took the temperature several times a day.
Can you tell, from the graph, on which day they recorded the lowest
temperature ?
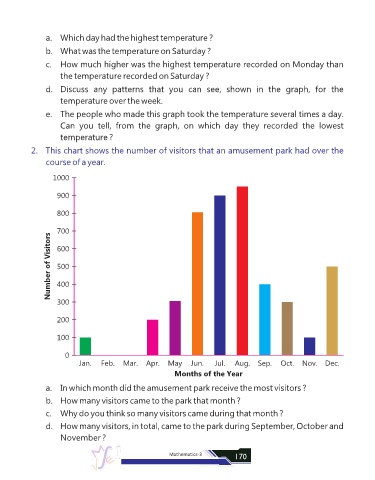
2. This chart shows the number of visitors that an amusement park had over the
course of a year.
1000
900
800
Number of Visitors 700
600
500
400
300
200
100
0
Jan. Feb. Mar. Apr. May Jun. Jul. Aug. Sep. Oct. Nov. Dec.
Months of the Year
a. In which month did the amusement park receive the most visitors ?
b. How many visitors came to the park that month ?
c. Why do you think so many visitors came during that month ?
d. How many visitors, in total, came to the park during September, October and
November ?
Mathematics-3 170