
Page 171 - Maths Class 03
P. 171
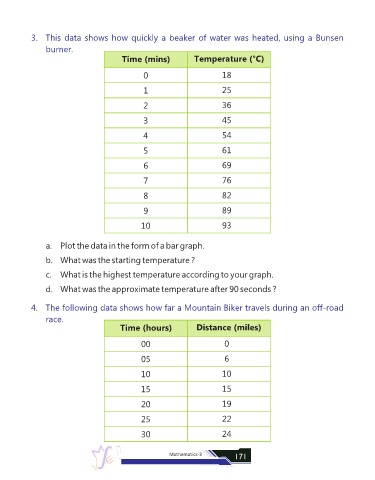
3.  This data shows how quickly a beaker of water was heated, using a Bunsen

                 burner.
                                           Time (mins)              Temperature (°C)


                                                   0                          18

                                                   1                          25

                                                   2                          36

                                                   3                          45

                                                   4                          54


                                                   5                          61

                                                   6                          69

                                                   7                          76


                                                   8                          82

                                                   9                          89

                                                  10                          93


                 a.  Plot the data in the form of a bar graph.

                 b.  What was the starting temperature ?

                 c.  What is the highest temperature according to your graph.


                 d.  What was the approximate temperature after 90 seconds ?


            4.  The following data shows how far a Mountain Biker travels during an off-road
                 race.
                                           Time (hours)              Distance (miles)


                                                  00                           0

                                                  05                           6

                                                  10                          10

                                                  15                          15

                                                  20                          19


                                                  25                          22

                                                  30                          24


                                                            Mathematics-3         171