
Page 172 - Maths Class 03
P. 172
a. Plot the data as a bar graph.
b. What distance did the rider cover ?
c. Approximately how long did it take to ride 12 miles ?
d. What can you say about his speed (in m.p.h.) as the race went on ?
e. How do you explain this ?
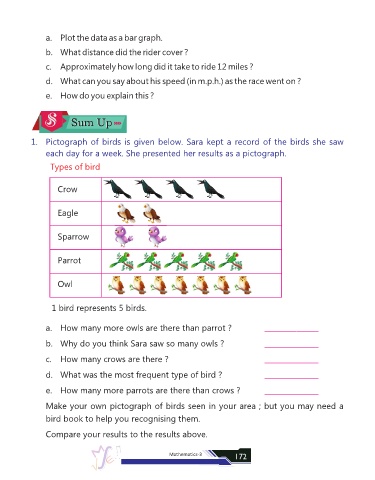
1. Pictograph of birds is given below. Sara kept a record of the birds she saw
each day for a week. She presented her results as a pictograph.
Types of bird
Crow
Eagle
Sparrow
Parrot
Owl
1 bird represents 5 birds.
a. How many more owls are there than parrot ? _______________
b. Why do you think Sara saw so many owls ? _______________
c. How many crows are there ? _______________
d. What was the most frequent type of bird ? _______________
e. How many more parrots are there than crows ? _______________
Make your own pictograph of birds seen in your area ; but you may need a
bird book to help you recognising them.
Compare your results to the results above.
Mathematics-3 172