
Page 166 - Maths Class 03
P. 166
A pictograph or picture graph is a graph that uses symbols to represent
data.
In other words, we can say that representing numerical data by using picture
symbols is called pictorial representation of data.
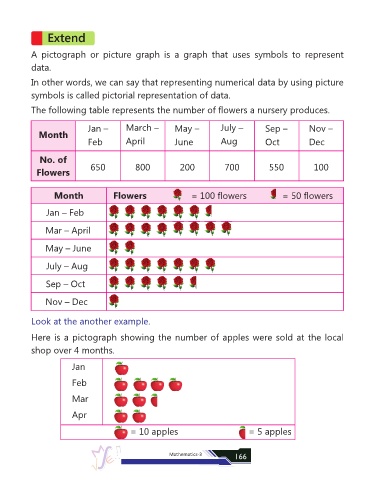
The following table represents the number of flowers a nursery produces.
Jan – March – May – July – Sep – Nov –
Month
Feb April June Aug Oct Dec
No. of
650 800 200 700 550 100
Flowers
Month Flowers = 100 flowers = 50 flowers
Jan – Feb
Mar – April
May – June
July – Aug
Sep – Oct
Nov – Dec
Look at the another example.
Here is a pictograph showing the number of apples were sold at the local
shop over 4 months.
Jan
Feb
Mar
Apr
= 10 apples = 5 apples
Mathematics-3 166