
Page 48 - Computer Class 08
P. 48
The Importance of Charts
8 Allows you to visualise data graphically.
8 It’s easier to analyse trends and patterns in the charts.
8 Easy to interpret compared to data in cells.
Creating Charts in Excel
4
Let’s Learn...
Let’s
Learn...
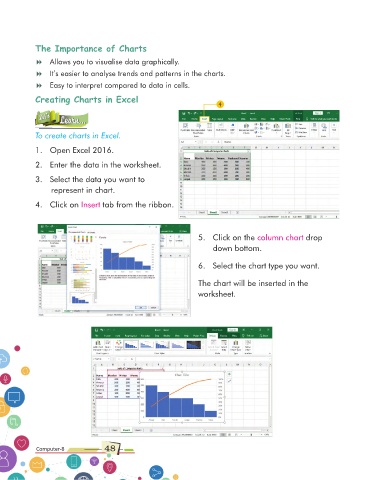
To create charts in Excel.
1. Open Excel 2016.
2. Enter the data in the worksheet.
3. Select the data you want to
represent in chart.
4. Click on Insert tab from the ribbon.
5. Click on the column chart drop
down bottom.
6. Select the chart type you want.
The chart will be inserted in the
worksheet.
Computer-8 48