
Page 44 - Computer Class 08
P. 44
It will merge the cells.
Charts in Excel 2016
A chart is a tool you can use in Excel to communicate data graphically. Charts allow your
audience to see the meaning behind the numbers and they make showing comparisons and
trends much easier.
Each of Excel’s 12 chart types has different features that make them better suited for specific
tasks. Pairing a chart with its correct data style will make the information easier to
understand, enhancing the communication within your small business.
Components of a Chart
The different parts that make up a chart are referred to as chart elements. Most of the items
on a chart can be repositioned by clicking on an item and dragging it with the right mouse
button. The black handles also indicate that the item could be moved, resized and
formatted.
All of these chart items (except the chart area) once selected can be moved around and
resized relative to other items.
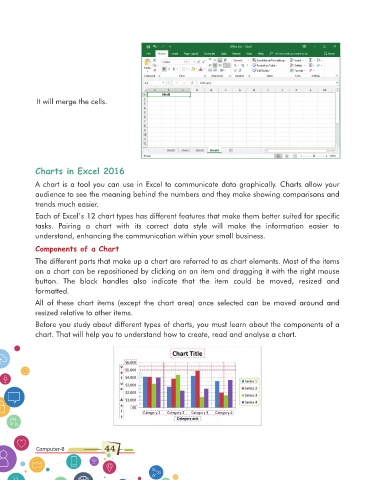
Before you study about different types of charts, you must learn about the components of a
chart. That will help you to understand how to create, read and analyse a chart.
Computer-8 44