
Page 50 - Computer Class 08
P. 50
Changing the Chart Style
A style is a set of formatting options. You can use a style to change the colour and format of
your chart. Excel 2016 has several predefined styles that you can use. They are numbered
from left to right, starting with 1, which is located in the upper left corner.
Let’s
Let’s Learn...
Learn...
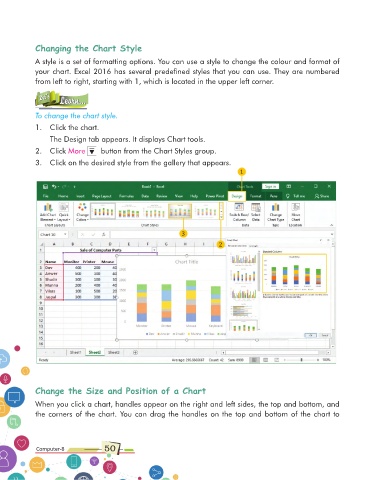
To change the chart style.
1. Click the chart.
The Design tab appears. It displays Chart tools.
2. Click More button from the Chart Styles group.
3. Click on the desired style from the gallery that appears.
1
3
2
Change the Size and Position of a Chart
When you click a chart, handles appear on the right and left sides, the top and bottom, and
the corners of the chart. You can drag the handles on the top and bottom of the chart to
Computer-8 50