
Page 47 - Computer Class 08
P. 47
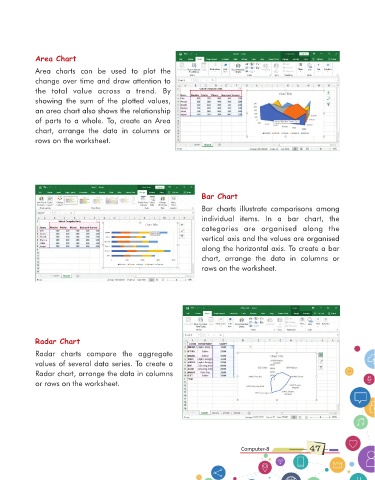
Area Chart

             Area  charts  can  be  used  to  plot  the
             change over time and draw attention to
             the  total  value  across  a  trend.  By
             showing  the  sum  of  the  plotted  values,
             an area chart also shows the relationship
             of  parts  to  a  whole.  To,  create  an  Area

             chart,  arrange  the  data  in  columns  or
             rows on the worksheet.


                                                                       Bar Chart
                                                                       Bar  charts  illustrate  comparisons  among
                                                                       individual  items.  In  a  bar  chart,  the

                                                                       categories  are  organised  along  the
                                                                       vertical axis and the values are organised
                                                                       along the horizontal axis. To create a bar
                                                                       chart,  arrange  the  data  in  columns  or
                                                                       rows on the worksheet.


             Radar Chart

             Radar  charts  compare  the  aggregate
             values of several data series. To create a
             Radar chart, arrange the data in columns
             or rows on the worksheet.


                                                                                    Computer-8              47