
Page 51 - Computer Class 08
P. 51
increase or decrease the height of the chart. You can drag the handles on the left and right
sides to increase or decrease the width of the chart. You can drag the handles on the corners
to increase or decrease the size of the chart proportionally. You can change the position of a
chart by clicking on an unused area of the chart and dragging.
Inserting Smart Chart
A SmartArt graphic can be added to track the hierarchy of an organisation or method or a
workflow process, list, or cycle.
Excel shows you some shapes to which you can add your own text, when you insert a Smart
Art graphic.
Let’s
1 Let’s Learn...
Learn...
2
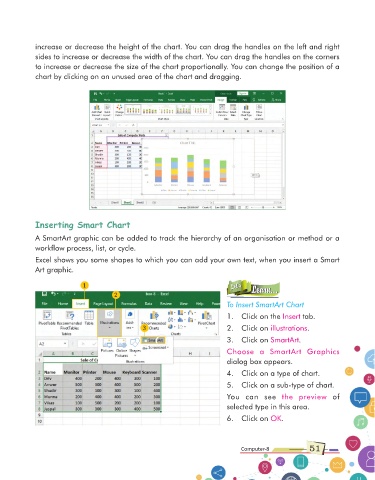
To Insert SmartArt Chart
1. Click on the Insert tab.
3 2. Click on illustrations .
3. Click on SmartArt .
Choose a SmartArt Graphics
dialog box appears.
4. Click on a type of chart.
5. Click on a sub-type of chart.
You can see the preview of
selected type in this area.
6. Click on OK .
Computer-8 51