
Page 209 - Maths Class 05
P. 209
Practice - 16.4
Practice - 16.4
Practice - 16.4
Practice - 16.4
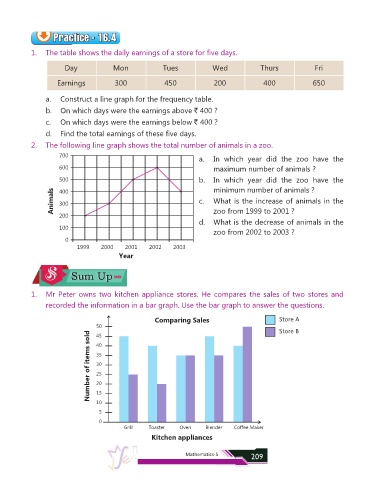
1. The table shows the daily earnings of a store for five days.
Day Mon Tues Wed Thurs Fri
Earnings 300 450 200 400 650
a. Construct a line graph for the frequency table.
b. On which days were the earnings above ` 400 ?
c. On which days were the earnings below ` 400 ?
d. Find the total earnings of these five days.
2. The following line graph shows the total number of animals in a zoo.
700
a. In which year did the zoo have the
600 maximum number of animals ?
500 b. In which year did the zoo have the
minimum number of animals ?
Animals 400 c. What is the increase of animals in the
300
200 zoo from 1999 to 2001 ?
d. What is the decrease of animals in the
100
zoo from 2002 to 2003 ?
0
1999 2000 2001 2002 2003
Year
1. Mr Peter owns two kitchen appliance stores. He compares the sales of two stores and
recorded the information in a bar graph. Use the bar graph to answer the questions.
Comparing Sales Store A
50 Store B
Number of items sold 35
45
40
30
25
20
15
10
5
0
Grill Toaster Oven Blender Coffee Maker
Kitchen appliances
Mathematics-5 209