Page 206 - Maths Class 05
P. 206

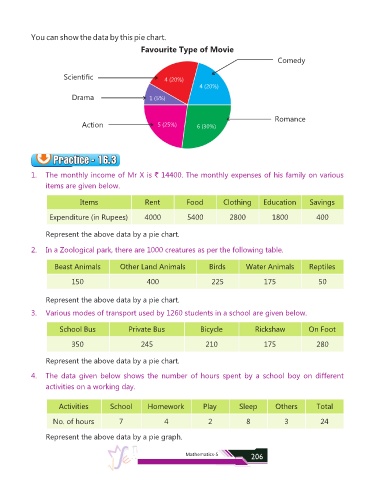
You can show the data by this pie chart.

                                                  Favourite Type of Movie
                                                                                                 Comedy


                       Scientific                         4 (20%)
                                                                      4 (20%)
                          Drama                      1 (5%)


                                                                                                Romance
                             Action                     5 (25%)      6 (30%)


                    Practice - 16.3
                    Practice - 16.3
                    Practice - 16.3
                    Practice - 16.3
            1.  The monthly income of Mr X is ` 14400. The monthly expenses of his family on various
                 items are given below.


                             Items                 Rent          Food         Clothing      Education       Savings

                  Expenditure (in Rupees)          4000           5400          2800           1800           400


                 Represent the above data by a pie chart.

            2.  In a Zoological park, there are 1000 creatures as per the following table.


                    Beast Animals          Other Land Animals            Birds        Water Animals         Reptiles

                          150                       400                   225               175                50


                 Represent the above data by a pie chart.

            3.  Various modes of transport used by 1260 students in a school are given below.

                      School Bus             Private Bus              Bicycle            Rickshaw           On Foot


                          350                     245                   210                 175               280

                 Represent the above data by a pie chart.

            4.  The  data  given  below  shows  the  number  of  hours  spent  by  a  school  boy  on  different

                 activities on a working day.


                     Activities        School       Homework           Play         Sleep       Others        Total

                   No. of hours           7               4              2            8            3            24


                 Represent the above data by a pie graph.


                                                                 Mathematics-5          206
   201   202   203   204   205   206   207   208   209   210   211