Page 201 - Maths Class 05
P. 201

16                     Data Handling


            Looking Back


            Collection  of  information  is  called  data.  Data  can  be  represented  graphically  to  give
            clear idea of what it represents. It is easier to interpret and organise data using pictorial

            representation. Some of the ways data can be represented pictorially are :

                 H   Pictographs               H   Tally Graphs

                 H   Bar Graphs                H   Pie Charts

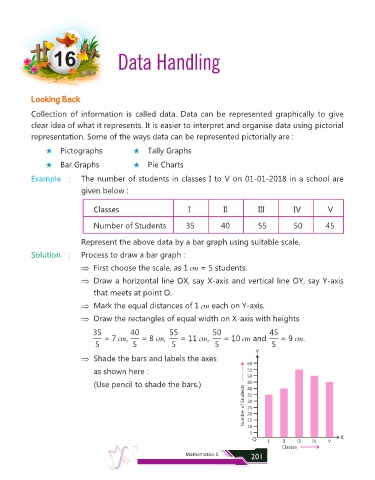
            Example   :      The number of students in classes I to V on 01-01-2018 in a school are
                             given below :


                                 Classes                          I           II          III          IV         V


                                 Number of Students              35          40           55           50        45


                             Represent the above data by a bar graph using suitable scale.
            Solution  :      Process to draw a bar graph :

                             Þ  First choose the scale, as 1 cm = 5 students.

                             Þ  Draw a horizontal line OX, say X-axis and vertical line OY, say Y-axis
                                 that meets at point O.

                             Þ  Mark the equal distances of 1 cm each on Y-axis.

                             Þ  Draw the rectangles of equal width on X-axis with heights

                                 35           40            55             50                 45
                                     = 7 cm,      = 8 cm,      = 11 cm,       = 10 cm and         = 9 cm.
                                  5            5            5              5                   5
                                                                                         Y
                             Þ  Shade the bars and labels the axes
                                                                                       60
                                 as shown here :                                       55
                                                                                       50
                                 (Use pencil to shade the bars.)                       45
                                                                                     Number of Students  30
                                                                                       40
                                                                                       35

                                                                                       25
                                                                                       20
                                                                                       15
                                                                                       10
                                                                                       5
                                                                                        O     I    II   III  IV   V    X
                                                                                                   Classes
                                                                 Mathematics-5          201
   196   197   198   199   200   201   202   203   204   205   206