
Page 174 - Maths Class 04
P. 174
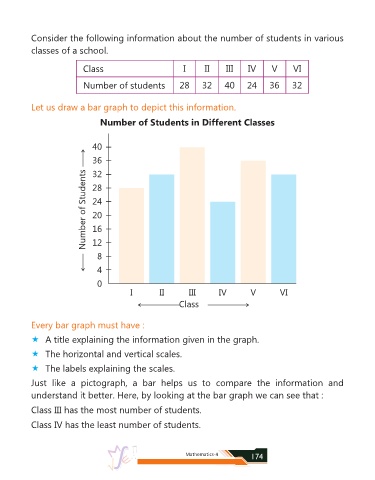
Consider the following information about the number of students in various
            classes of a school.


                              Class                             I       II     III     IV      V      VI


                              Number of students               28      32      40     24      36      32


            Let us draw a bar graph to depict this information.


                                    Number of Students in Different Classes


                                 40

                                 36
                              Number of Students  28
                                 32


                                 24

                                 20

                                 16

                                 12
                                   8


                                   4
                                   0
                                              I         II        III        IV         V         VI

                                                               Class


            Every bar graph must have :

            «  A title explaining the information given in the graph.


            «  The horizontal and vertical scales.

            «  The labels explaining the scales.

            Just  like  a  pictograph,  a  bar  helps  us  to  compare  the  information  and
            understand it better. Here, by looking at the bar graph we can see that :


            Class III has the most number of students.

            Class IV has the least number of students.


                                                                 Mathematics-4          174