
Page 172 - Maths Class 04
P. 172
14 Data Handling
Looking Back
The pictograph is a pictorial representation of data. We have learnt about
how to interpret data using list, pictograph and bar graph. Here, we will
discuss more about bar graph and pie chart.
1. The following list shows the number of hours in which 4 friends read books over
the weekend. Fill the total column before answering the questions.
Name/Day Friday Saturday Sunday Total
Aniket 3 hours 4 hours 4 hours
Rekha 3 hours 2 hours 5 hours
Prakash 2 hours 4 hours 3 hours
Deepa 3 hours 2 hours
———
a. Who spent the most time in reading on Sunday ?
b. Who spent the most time in reading on weekend ?
c. Who read for the most hours ?
d. Who did not read on Saturday ?
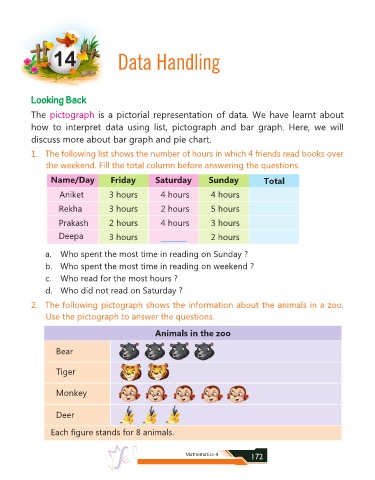
2. The following pictograph shows the information about the animals in a zoo.
Use the pictograph to answer the questions.
Animals in the zoo
Bear
Tiger
Monkey
Deer
Each figure stands for 8 animals.
Mathematics-4 172